|
CHART 3:
WORLD TRADE: SHARE OF EXPORTS - (2019)
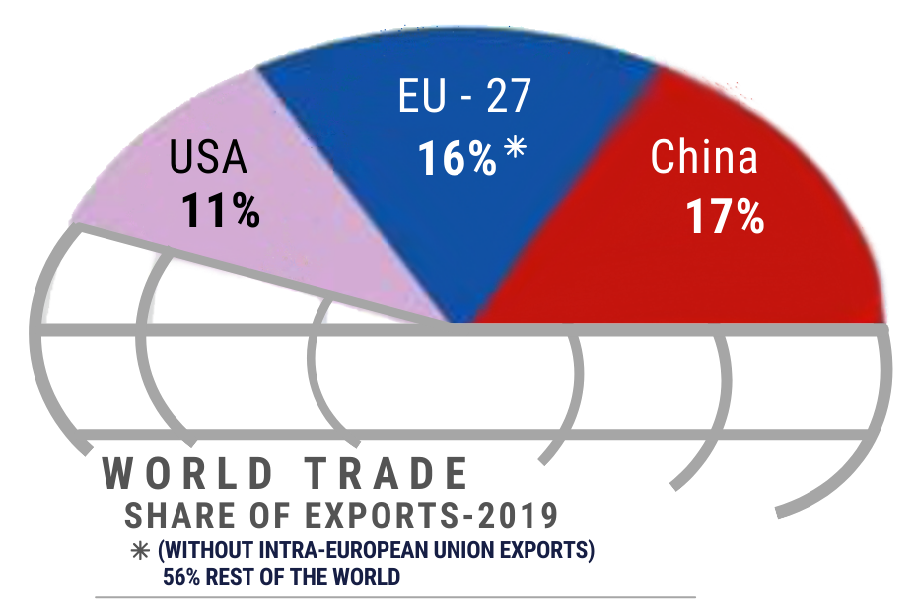
Source: Prepared by OCEX based on Der Spiegel. January 2021.
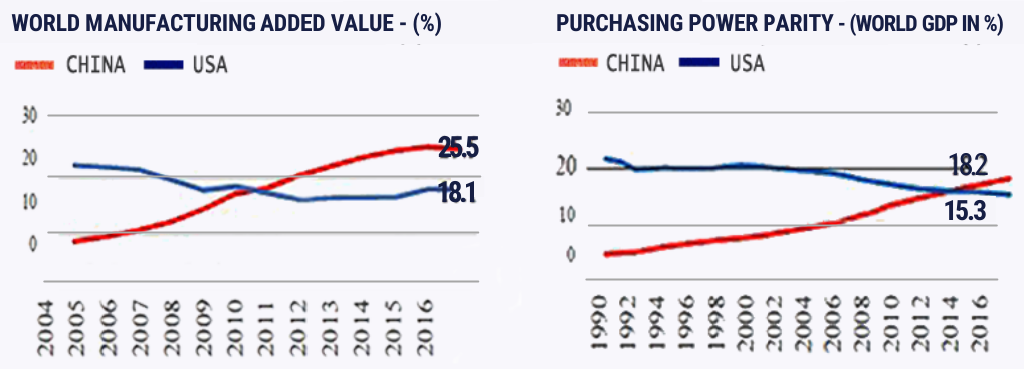
Since the onset of the financial crisis in 2008, known as the subprime crisis, China has accounted for 45% of the increase in global GDP. In 1990, some 750 million Chinese lived in extreme poverty; today, less than 10 million are poor in China. That means that, between 1990 and 2018, China's economy has achieved two-thirds of the world's poverty reduction. China is also accounts for half of the total increase in patent applications over the same period.
CHART 4:
CHINA: TREND OF POVERTY (1981 - 2016)
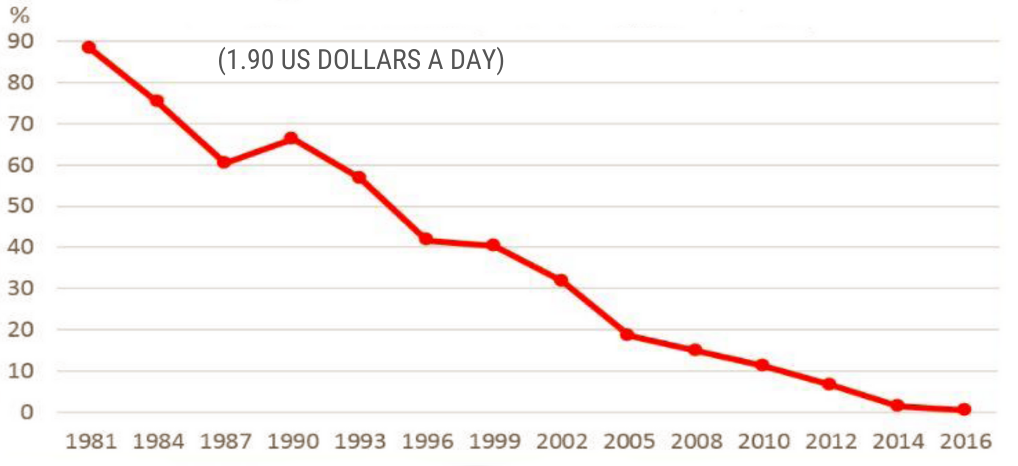
Source: World Bank. 2019.
Trade openness as a driver of China's development. Since 1978 and under the leadership of Deng Xiaoping, China has been outlining a strategy to integrate its economy into the world market. This process intensified with China's entry into the World Trade Organisation (WTO) in December 2001, accelerating a process of tariff reduction that further boosted the influx of foreign investment and the development of export sectors. In the early 1990s, the average tariff had fallen to 30%; in 1995, it fell below 20% and in the 21st century it is less than 5%.
The sum of these elements has led China to enjoy an admirable economic development that has significantly reduced the gap between China's GDP per capita and that of the rest of the world. This has benefited the Chinese market with a high level of consumer power.
CHART 5:
CHINA'S ECONOMIC GROWTH
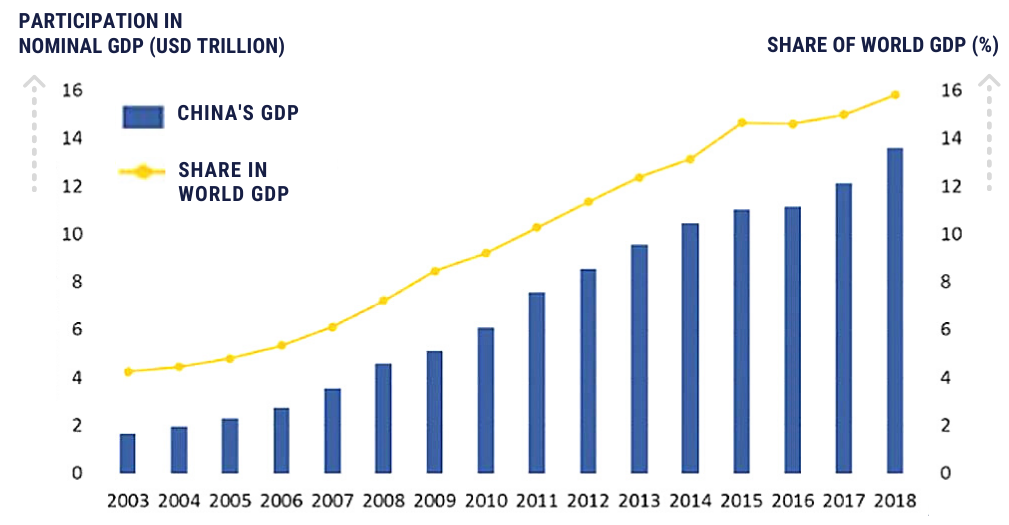
Source: World Bank and OECD. 2019.
Costa Rica's trade policy regarding China. The emergence of China's prominence in the world meant that, in their development policies, emerging countries had to give China the corresponding strategic weight, especially in their trade policies. In 2006, Costa Rica found that China had almost suddenly become its second largest trading partner, an effect linked to exports of electronic components from the INTEL plant in Costa Rica's Free Trade Zone.Our exportable supply to China was concentrated in 96% in electronic processors and controllers (73.4%) and computer parts and accessories (22.6%). The rest of the exports to China (4%) were not representative of national production (waste, copper scrap, and other minor products, such as tanned bovine or equine hides).
China's supply is more diversified from China we imported all kinds of products on a small scale. However, none of them alone amounted to 2.5%. This is the picture that emerges when one looks at the small percentage of the five main products that Costa Rica imported from China at that time:
- (2.4%) radio telephone and radio broadcasting transmitting apparatus;
- (2.1%) cotton fabrics;
- (2.1%) footwear;
- (1.5%) motorbikes and tricycles;
- (1.4%) automatic data processing machines.
Although the exports of Costa Rica's endogenous productive apparatus to China were not substantial, the weight of Intel's exports already showed China's place in global chainages. It was an unmistakable sign that maintaining relations with Taiwan, at the expense of diplomatic relations with China, was not the best public policy bet.
Chronicle of the process of approving the FTA with China. In 2006, with the Arias administration's arrival, it was understood that it was important to take a step that would put China's relevance in the world economy on Costa Rica's trade agenda.
On 1 June 2007, among the objectives of its trade policy, Costa Rica decided to initiate diplomatic relations with the People's Republic of China. This was the first step in its comprehensive strategy for trade integration in Asia. It was a wise and forward-looking step. Since then, in addition to the People's Republic of China, our country has also ratified Free Trade Agreements (FTAs) with Singapore and the Republic of Korea.
Timeline of relations between Costa Rica and China:
2006:
- China ranks second in importance as an export destination for Costa Rican products..
2007:
- On 1 June, diplomatic relations between Costa Rica and China are established.
- October, Costa Rica and China decide to initiate a feasibility study to determine the viability of an FTA.
2008:
- Costa Rica and China begin six rounds of negotiations leading to the signing of an FTA with China.
2010:
- From 8 to 10 February, the sixth and final round of negotiations between the two countries takes place in San José.
- On 14 April, the decree sending the draft FTA law to the national legislature for ratification is signed.
2011:
- On 3 March, the FTA has its first legislative debate for ratification.
- On 31 May, the FTA with China is ratified in the second debate by the Legislative Assembly.
- On 21 June, Law No. 8953 approves the FTA between Costa Rica and China.
- On 29 July, with the publication in the Gazette N0 146, the FTA between Costa Rica and China enters into force.
- On 1 August, the FTA enters into force for both nations.
Thus, both nations formally enjoy the benefits of preferential trade.As of 1 August 2011, 99.6% of Costa Rican exports could enter the Chinese market without paying tariffs.
10 years after the entry into force of the FTA with China. Since the signing of the FTA with China, trade with that country has been growing at an annual rate of 9.1%. In 2010, it was US$1023 million. Ten years later it had doubled and in 2019 it reached US$2245 million. In this growth, as was to be expected, the Chinese market had a huge untapped potential for Costa Rica's exports.
The Costa Rican market, on the other hand, had been more saturated for imports from China, even before the signing of the treaty. This explains the dynamism of Costa Rican exports, which have grown by 12.6% annually. Imports from China, on the other hand, have grown at a slower rate of 9% per year. (COMEX, 2019).
CHART 6:
COSTA RICA: TRADE WITH CHINA (2007 – 2019)
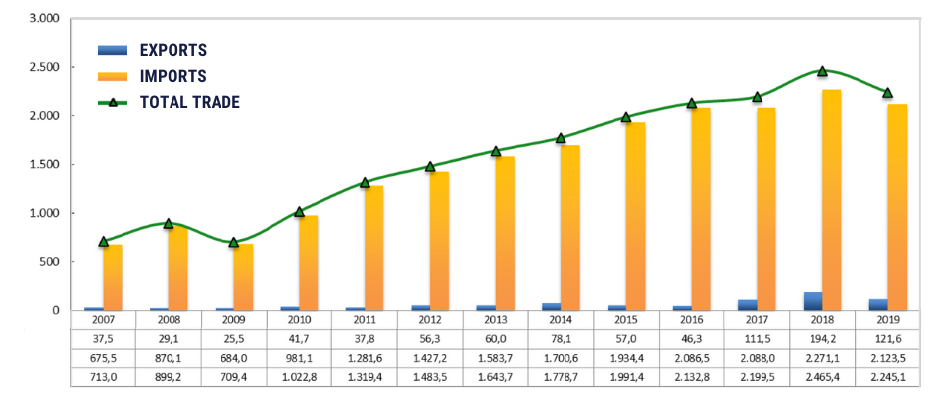
Source: COMEX based on data from PROCOMER and BCCR. 2019.
Forging economic partnership and cooperation links. In 2007, an Investment Promotion and Protection Agreement was signed with China, under the name of Asia-Pacific Economic Cooperation Forum (APEC).
As a cooperation mechanism, it is aimed at trade promotion and facilitation, investment protection, economic and technical cooperation, but it was only in March 2016 that our Legislative Assembly approved it.
This complementary agreement with the FTA with China constitutes a legal instrument to offer predictability, security and transparency to Chinese companies seeking to invest on costarrican national soil.
However, Chinese investments have still had very little dynamism. Between 2010 and 2019, Costa Rica has attracted only US$ 32.6 million from China, or 0.1% of the total received by the country in this period.
The reciprocity between Costa Rica and China goes beyond trade. In San José, in the national park "La Sabana", we can enjoy a new football stadium, a product of Chinese ingenuity. Meanwhile, en route to the Atlantic, a Chinese company is building a highway, Route 32, which will be decisive for our exports to Europe.
Readings consulted:
|